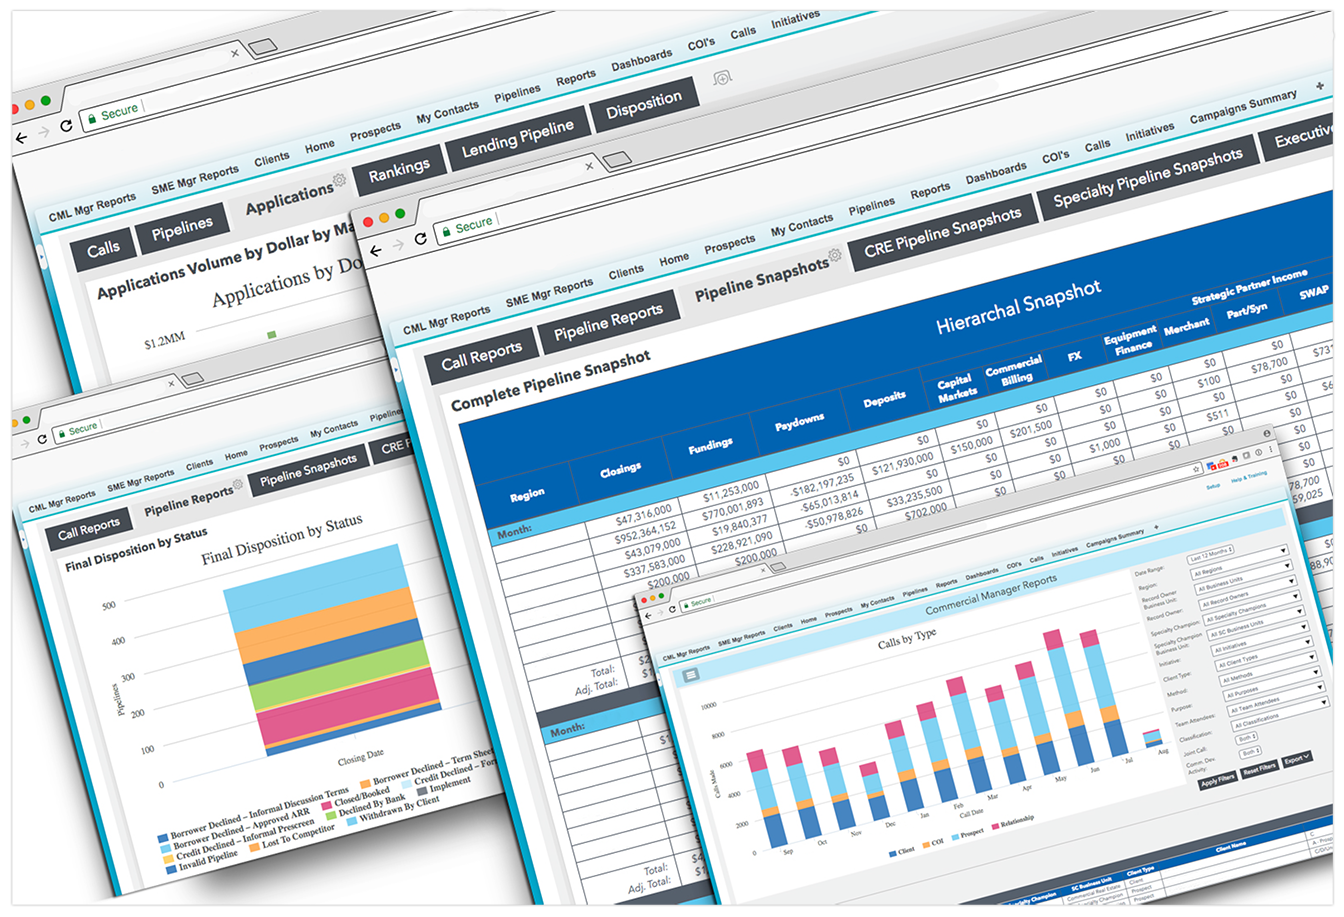
Dashboard Reporting
Your data holds the key to measuring your success, but you must be able to properly utilize, organize, and visualize your data for maximum effectiveness. Syntropy Group’s Dashboard Reporting solution takes your data to create aesthetically pleasing graphs, charts and tables as well as offers robust filter, query, and export features.
Key Benefits:
Up-to-Date
– Data updated using extracts.
– Able to support real-time updates.
Customizable Dashboards
– We work with you to build default views to meet your needs.
– Each user can customize their own unique default dashboard view as well as saved pre-filtered reports.
Filterable
– Pre-defined filters provide powerful analytical capabilities.
– Easy-to-use query functionality – user-friendly for non-technical users.
Detailed Record View
– When viewing a dashboard or filtered selection, the underlying records are also viewable in table form.
– Allows for quickly inspecting contents of your reports for refinement as needed.
– The detailed records are exportable to a CSV file that can be easily imported into your software tool of choice for more extensive analysis.
– Charts and graphs can be exported as PDF files for presentations or sharing.